Stellar Physics and the Hertzsprung–Russell Diagram
A star is a self-gravitating sphere of gas, bound by gravity and continuously generating energy through thermonuclear reactions in its interior. Only a handful of fundamental physical quantities—mass, radius, luminosity, effective temperature, and chemical composition—are needed to largely determine a star’s structure, appearance, and evolutionary fate. This page organizes the quantitative relationships among these parameters in the order “fundamental physical quantities → spectral classification → H–R diagram → stellar evolution → nucleosynthesis.”
Fundamental Physical Quantities of Stars
Section titled “Fundamental Physical Quantities of Stars”A star is usually described using the following quantities. Most are expressed in units of the solar value, with the Sun denoted by the subscript ⊙.
| Quantity | Symbol | Solar value | Notes |
|---|---|---|---|
| Mass | M | M⊙ = 1.989×10³⁰ kg | The single most important parameter governing structure and evolution |
| Radius | R | R⊙ = 6.96×10⁸ m | Radius of the photosphere |
| Luminosity | L | L⊙ = 3.828×10²⁶ W | Total energy radiated per unit time |
| Effective temperature | T_eff | T⊙ ≈ 5772 K | Surface temperature of the equivalent blackbody |
| Metallicity | [Fe/H] | 0 (defined as the reference) | Relative abundance of elements heavier than hydrogen and helium |
The effective temperature is defined as the temperature of a blackbody that radiates the same total power as the star. It approximates the star as a blackbody, characterizing its surface thermal state with a single temperature.
Luminosity, radius, and effective temperature are linked by the Stefan–Boltzmann law:
L = 4 π R² σ T_eff⁴where σ = 5.67×10⁻⁸ W·m⁻²·K⁻⁴ is the Stefan–Boltzmann constant. This relation shows that at the same temperature, a larger radius means higher luminosity; at the same luminosity, a larger radius means lower temperature. This is precisely the physical origin of why giants and white dwarfs sit at opposite extremes of the H–R diagram. Normalized to solar values, it is often written as:
L/L⊙ = (R/R⊙)² × (T_eff/T⊙)⁴Metallicity refers to the abundance of elements heavier than helium (collectively called “metals” in astronomy) in a star, usually expressed as the logarithmic ratio of iron to hydrogen, relative to the Sun:
[Fe/H] = log10( (N_Fe/N_H)_star / (N_Fe/N_H)_sun )[Fe/H] = 0 corresponds to solar composition; -1 means an iron abundance one-tenth that of the Sun, and -2 one-hundredth. On this basis, stars are broadly divided into three stellar populations:
| Population | Metallicity | Age | Typical location |
|---|---|---|---|
| Population I | Higher, near or above solar | Younger | Galactic disk, spiral arms, open clusters |
| Population II | Lower | Old | Galactic halo, globular clusters |
| Population III | Nearly zero ([Fe/H] < -6) | Earliest in the universe | The theoretical first generation of stars, not yet directly observed |
Metallicity also affects spectral line strengths, opacity, and evolutionary details, and is a central parameter in stellar archaeology and studies of galactic chemical evolution.
Spectral Classification (OBAFGKM)
Section titled “Spectral Classification (OBAFGKM)”The types and strengths of absorption lines in a stellar spectrum are primarily determined by the photospheric temperature. The Harvard classification system arranges stars from high to low temperature into seven main spectral types O, B, A, F, G, K, M, with colors ranging from blue to red. The table below summarizes each type’s effective temperature, color, characteristic spectral lines, typical main-sequence mass, and proportion among stars.
| Spectral type | Effective temperature (K) | Color | Characteristic lines | Main-sequence mass (M⊙) | Proportion | Example star |
|---|---|---|---|---|---|---|
| O | ≥ 33000 | Blue | Ionized helium (He II), Si IV, O III; weak hydrogen lines | ≥ 16 | ~0.00003% | Alnitak |
| B | 10000–33000 | Blue-white | Neutral helium (He I) strongest at B2; moderate hydrogen lines | 2.1–16 | ~0.1% | Rigel |
| A | 7300–10000 | White | Hydrogen Balmer lines strongest at A0; ionized metals (Fe II, Mg II) | 1.4–2.1 | ~0.6% | Sirius, Vega |
| F | 6000–7300 | Yellow-white | Weakening hydrogen lines; strengthening Ca II H and K lines | 1.0–1.4 | ~3% | Procyon |
| G | 5300–6000 | Yellow | Prominent Ca II H and K lines; numerous neutral metals | 0.8–1.04 | ~8% | The Sun |
| K | 3900–5300 | Orange | Very weak hydrogen lines; neutral metals (Mn I, Fe I, Si I) | 0.45–0.8 | ~12% | Arcturus |
| M | 2300–3900 | Red | Molecular oxide bands (especially TiO); all neutral metals | 0.08–0.45 | ~76% | Betelgeuse, Proxima Centauri |
Note: the proportion column refers to the approximate number ratio of each type of star in the Milky Way. M-type dwarfs (red dwarfs) are the most numerous, while hot, bright O-type stars are extremely rare—this runs exactly counter to the impression from the naked-eye night sky that bright stars are mostly hot stars, because although O- and B-type stars are few, they are exceptionally luminous and easily seen across great distances.
Subtypes and Luminosity Classes
Section titled “Subtypes and Luminosity Classes”A complete stellar classification consists of three parts: “spectral type + subtype + luminosity class,” for example the Sun is G2V.
- Subtype (0–9): Each main spectral type is further subdivided into 10 grades, 0 through 9, with 0 the hottest and 9 the coolest. Decimal subdivisions may be used (e.g., O9.5). The Sun’s G2 indicates that it lies on the hotter side of the G type.
- Luminosity class: Denoted with Roman numerals by the Yerkes (Yerkes/MKK) system, this reflects luminosity and radius, essentially distinguishing a star’s vertical position on the H–R diagram. Stars of the same temperature have different line widths (giants have tenuous, low-pressure atmospheres, giving narrower, sharper lines), allowing the luminosity class to be determined.
| Luminosity class | Name | Meaning |
|---|---|---|
| 0 / Ia⁺ | Hypergiant | Late-evolutionary stars of extremely high luminosity |
| Ia | Luminous supergiant | High-luminosity supergiant |
| Iab | Intermediate supergiant | Between Ia and Ib |
| Ib | Less luminous supergiant | Lower-luminosity supergiant |
| II | Bright giant | Between giant and supergiant |
| III | Giant | Ordinary giant, e.g., Arcturus (K1.5III) |
| IV | Subgiant | Between giant and main sequence |
| V | Main-sequence star / dwarf | Core hydrogen-burning main-sequence star; the Sun belongs to this class |
| VI / sd | Subdwarf | Lower luminosity than the main sequence at the same temperature |
| D / VII | White dwarf | Degenerate stellar remnant, subdivided with its own D system |
A common mnemonic is “Oh Be A Fine Girl/Guy, Kiss Me.”
The Hertzsprung–Russell Diagram
Section titled “The Hertzsprung–Russell Diagram”The Hertzsprung–Russell diagram (H–R diagram) was proposed independently by Hertzsprung and Russell in the early 20th century and is the single most central tool in stellar physics. It plots a group of stars as a scatter diagram along the following two axes:
- Horizontal axis: Effective temperature or spectral type, which by convention decreases from left to right (hot on the left, cool on the right). An equivalent coordinate is the color index B−V (increasing to the right).
- Vertical axis: Luminosity or absolute magnitude, increasing upward (bright at the top, faint at the bottom).
The key point is that stars are not randomly scattered but cluster along several clear sequences, directly reflecting the regularities of stellar structure and evolution.
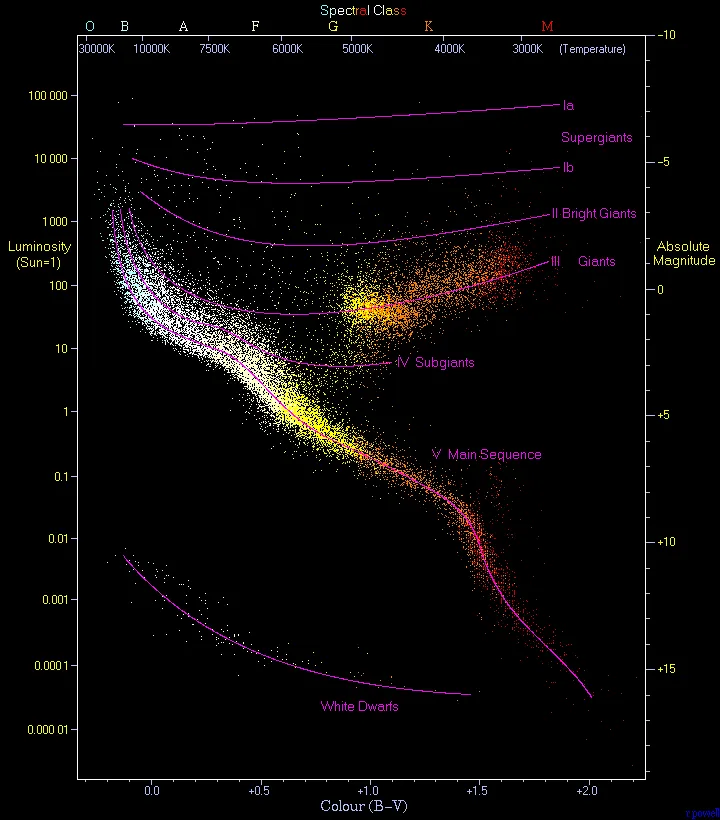
The following main regions can be identified in the diagram:
| Region | Position | Physical characteristics |
|---|---|---|
| Main sequence | The diagonal band running from upper left to lower right | Core hydrogen burning; about 90% of stars lie here, including the Sun |
| Red giant branch | Upper right, low temperature and high luminosity | Core hydrogen exhausted, outer layers expand and cool, radius increases |
| Horizontal branch | To the left of the giant region, intermediate luminosity | Low-metallicity stars undergoing stable core helium burning after the helium flash |
| Asymptotic giant branch (AGB) | Above and parallel to the red giant branch | Double-shell hydrogen and helium burning, generating energy more rapidly |
| Supergiants | Top of the diagram | Late-stage evolution of massive stars, extremely high luminosity |
| White dwarfs | Lower left, high temperature and low luminosity | Earth-sized degenerate remnants with very small emitting areas |
The diagonal orientation of the main sequence arises from the mass–luminosity relation: more massive stars are both hotter and brighter and lie at the upper left, while less massive stars are both cooler and fainter and lie at the lower right. The departure of giants and white dwarfs from the main sequence is a direct manifestation of the Stefan–Boltzmann law—at the same temperature, vast differences in radius lead to enormous differences in luminosity.
The Mass–Luminosity Relation and Main-Sequence Lifetime
Section titled “The Mass–Luminosity Relation and Main-Sequence Lifetime”For main-sequence stars, there is an approximate power-law relationship between luminosity and mass, called the mass–luminosity relation:
L/L⊙ ≈ (M/M⊙)^aThe exponent a varies with the mass range:
| Mass range (M⊙) | Exponent a | Approximate relation |
|---|---|---|
| < 0.43 | 2.3 | L/L⊙ ≈ 0.23 (M/M⊙)^2.3 |
| 0.43–2 | 4.0 | L/L⊙ = (M/M⊙)^4 |
| 2–55 | 3.5 | L/L⊙ ≈ 1.4 (M/M⊙)^3.5 |
| > 55 | ~1 | L/L⊙ ≈ 32000 (M/M⊙) |
The frequently cited value a ≈ 3.5 applies to intermediate-mass stars near the Sun. The mass–luminosity relation means that a slight increase in mass causes a sharp rise in luminosity.
The main-sequence lifetime is determined by the burnable hydrogen reservoir (proportional to M) divided by the burning rate (proportional to L):
t ∝ M / L ∝ M / M^3.5 = M^-2.5Taking the Sun’s lifetime of about 10 billion years as the reference:
| Mass (M⊙) | Spectral type (main sequence) | Main-sequence lifetime (order of magnitude) |
|---|---|---|
| 0.1 | M | Hundreds of billions to trillions of years |
| 1 | G | ~10 billion years |
| 2 | A | ~1 billion years |
| 10 | B | ~30 million years |
| 25 | O | ~a few million years |
This shows that although more massive stars have more fuel, they consume it at a far higher rate and therefore have extremely short lifetimes. This is the quantitative reason why “massive stars are fleeting in the universe.”
Stellar Evolution
Section titled “Stellar Evolution”A star’s position on the H–R diagram shifts with age, and its ultimate fate is determined by its initial mass. Below, evolution is described along two main tracks according to mass.
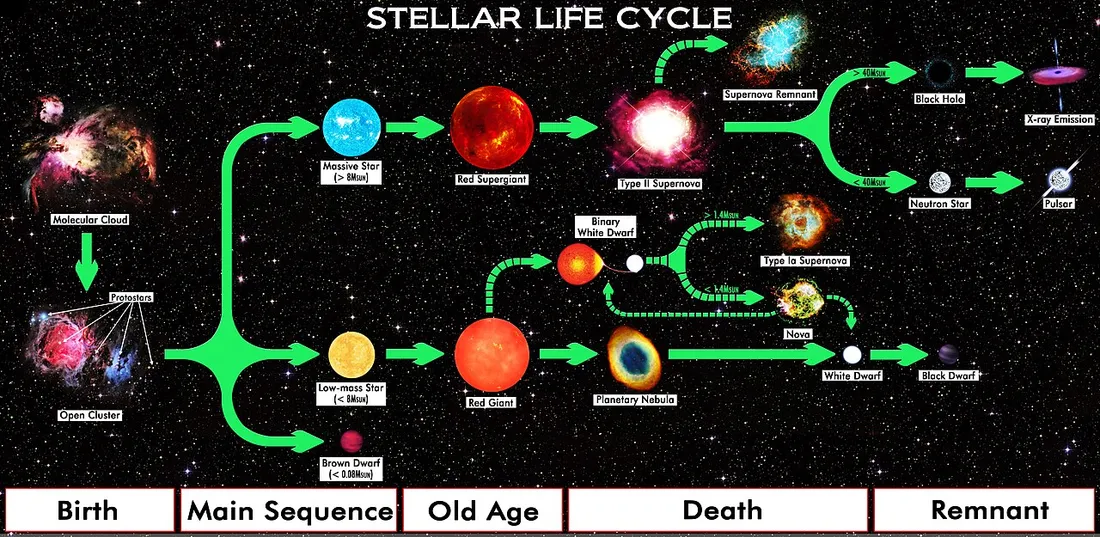
Common Starting Point: Protostar and Main Sequence
Section titled “Common Starting Point: Protostar and Main Sequence”All stars begin with the gravitational collapse of a giant molecular cloud. The collapsing core forms a hot, rotating protostar, which continuously accretes surrounding gas and heats up.
- When the core mass is below about 0.08 M⊙, the central temperature never reaches the ignition conditions for hydrogen fusion, and it can only become a brown dwarf (which can briefly burn deuterium), not counting as a true star.
- When the core temperature is high enough to ignite hydrogen fusion, the star enters the main sequence: the core steadily fuses hydrogen into helium, with radiation pressure and gravity in hydrostatic equilibrium. This is the longest and most stable stage of a star’s life.
Low- and Intermediate-Mass Stars (about 0.08–8 M⊙)
Section titled “Low- and Intermediate-Mass Stars (about 0.08–8 M⊙)”- Main-sequence stage: Core hydrogen burning. The Sun (1 M⊙) lasts about 10 billion years and is currently in the middle of its main-sequence lifetime. Very low-mass red dwarfs (0.1 M⊙) can have main-sequence lifetimes of hundreds of billions of years, far exceeding the present age of the universe.
- Subgiant and red giant branch: Core hydrogen is exhausted, and fusion shifts to a hydrogen shell outside the core. The outer layers expand and cool, the star moves toward the upper right of the H–R diagram, and the radius can grow by tens or even hundreds of times, becoming a red giant.
- Helium flash and horizontal branch: In stars of about 0.6–2 M⊙, core helium ignites under electron-degenerate conditions, producing a helium flash—energy generation can briefly reach 10⁸ times the Sun’s luminosity (lasting a few days) or even 10¹¹ times (lasting a few seconds), but nearly all the energy is absorbed by the thermal expansion of the degenerate core and is not visible externally. Afterward the core enters stable helium burning, and the star settles onto the horizontal branch of the H–R diagram.
- Asymptotic giant branch (AGB): After core helium is exhausted, a carbon–oxygen core forms, surrounded by alternately burning hydrogen and helium double shells, and the star brightens again along the asymptotic giant branch, undergoing multiple thermal pulses.
- Planetary nebula and white dwarf: At the end of the AGB phase, the outer layers are blown away by strong stellar winds, forming a planetary nebula with a hot carbon–oxygen core left behind at the center. This core, with a mass of about 0.6 M⊙ and compressed to the size of the Earth, resists gravity through electron degeneracy pressure and becomes a white dwarf, which then slowly cools and dims.
Massive Stars (about 8 M⊙ and above)
Section titled “Massive Stars (about 8 M⊙ and above)”- Main-sequence stage: Burning rapidly on the main sequence, massive O- and B-type stars last only a few million to a few tens of millions of years.
- Red supergiant and multistage burning: They expand into red supergiants (the most massive ones, due to intense radiation pressure shedding their outer layers, may be unable to turn red). After hydrogen and helium are exhausted, the core successively ignites fusion of heavier elements: carbon burning (producing neon, sodium, magnesium), neon burning, oxygen burning, and silicon burning, building up an “onion-like” structure layer by layer, until iron-peak elements accumulate in the core.
- Iron core collapse: Iron has the highest nuclear binding energy, so neither fusion nor fission releases energy. When the iron core grows to the effective Chandrasekhar mass (about 1.34–1.8 M⊙), electrons are captured by the iron core, degeneracy pressure collapses, and the core collapses in less than a second.
- Core-collapse supernova: The gravitational energy released by the collapse, together with an enormous flux of neutrinos, drives the ejection of the outer layers, producing a Type II, Type Ib, or Type Ic supernova explosion. SN 1987A in 1987 detected the expected neutrino burst.
- Compact remnant: The fate of the collapsing core depends on the remaining mass:
- If the remaining mass is between about 1.4 and 2.5 M⊙, protons and electrons merge into neutrons, supported by neutron degeneracy pressure, forming a neutron star with a radius of only about 10 km and a rotation period that can be as short as milliseconds (a pulsar).
- If the remaining mass exceeds the Tolman–Oppenheimer–Volkoff limit (TOV limit, about 2–3 M⊙), even neutron degeneracy pressure cannot resist gravity, and it collapses into a black hole.
The table below summarizes the correspondences for the two main tracks:
| Initial mass (M⊙) | Main-sequence spectral type | Late-stage evolution | Final remnant |
|---|---|---|---|
| < 0.08 | (brown dwarf) | Hydrogen does not ignite | Brown dwarf |
| 0.08–8 | M–A | Red giant → planetary nebula | White dwarf |
| 8–25 (approx.) | B–O | Red supergiant → supernova | Neutron star |
| > 25 (approx.) | O | Red supergiant / Wolf–Rayet star → supernova | Black hole |
(The mass boundaries fluctuate with metallicity, rotation, binary interactions, and other factors; the table above gives typical values.)
Nucleosynthesis
Section titled “Nucleosynthesis”Stars not only shine but are also the main production sites of the elements in the universe. Nucleosynthesis gradually forges the hydrogen and helium left over from the Big Bang into heavier elements.
Two Pathways of Hydrogen Burning
Section titled “Two Pathways of Hydrogen Burning”Main-sequence stars generate energy in their cores by fusing hydrogen into helium, the net reaction being the fusion of 4 protons into 1 helium-4 nucleus, releasing about 26.7 MeV of energy. There are two specific pathways, and which dominates depends on the core temperature (i.e., the mass):
- Proton–proton chain (p-p chain): Dominates in stars with masses ≤ that of the Sun (about ≤ 1.3 M⊙). Protons combine directly and stepwise, producing deuterium and helium-3 along the way, ultimately synthesizing helium-4. About 99% of the Sun’s energy comes from this chain.
- CNO cycle: Dominates in stars with masses > about 1.3 M⊙, requiring a higher core temperature. Carbon, nitrogen, and oxygen nuclei act as catalysts: a carbon nucleus successively captures 4 protons, transforming along the way into various isotopes of nitrogen and oxygen, finally releasing a helium-4 nucleus and reverting to carbon, repeating the cycle. The CNO cycle is extremely sensitive to temperature, so massive stars have concentrated energy generation and short lifetimes.
Heavy-Element Synthesis After the Main Sequence
Section titled “Heavy-Element Synthesis After the Main Sequence”| Burning stage | Main products | Site |
|---|---|---|
| Hydrogen burning | Helium | Main-sequence core, red giant shell |
| Helium burning (3α process) | Carbon, oxygen | Horizontal branch, AGB, supergiant core |
| Carbon burning | Neon, sodium, magnesium | Massive-star core |
| Neon/oxygen/silicon burning | Up to iron-peak elements (Fe, Ni) | Late evolutionary stage of massive stars |
Fusion proceeds only as far as iron: iron-peak elements have the highest nuclear binding energy, and further fusion absorbs rather than releases energy, so stellar nucleosynthesis cannot get past iron by fusion.
Elements heavier than iron (gold, silver, uranium, thorium, etc.) are mainly produced through neutron capture:
- s-process (slow neutron capture): The neutron capture rate is slower than β decay, occurring in environments with low neutron flux such as AGB stars, producing about half of the heavy elements such as strontium and barium.
- r-process (rapid neutron capture): Neutron capture is extremely fast, requiring a very high neutron flux, and occurs in extreme events such as core-collapse supernovae and neutron star mergers, producing large quantities of heavy nuclei such as gold and uranium.
These elements are ejected back into the interstellar medium by supernova explosions and mergers, becoming the raw material for the next generation of stars, planets, and even life.
References
Section titled “References”- Stellar classification — Wikipedia: Detailed tables of the temperatures, colors, characteristic spectral lines, and Yerkes luminosity classes of the OBAFGKM spectral types.
- Stellar evolution — Wikipedia: The full process of mass-dependent stellar evolution, including key stages such as the helium flash and iron core collapse, and the relevant mass thresholds.
- Hertzsprung–Russell diagram — Wikipedia: The coordinate definitions of the H–R diagram and the structure of the main sequence and the various evolutionary sequences.
- Mass–luminosity relation — Wikipedia: The piecewise exponents of the mass–luminosity relation for main-sequence stars and the scaling relation for main-sequence lifetime.
- Stellar nucleosynthesis — Wikipedia: The proton–proton chain, the CNO cycle, and heavy-element synthesis via the s- and r-processes.
- Metallicity — Wikipedia: The definition of metallicity [Fe/H] and the classification of Populations I/II/III.